
I’ve coded a crime map for Muckgers, an online student-run publication that I contribute to. I’ve explained in detail in several posts on the site what I’ve done and improved upon, but I thought I would go into more about code and concepts on my blog.
The Backstory
I started at Muckgers back in October 2013, working on photography, graphics, a few articles, and data projects. One of the data projects included a massive data dump of student surveys, queried, cleaned up, and graphed for insight. Another was a project where I scraped data from CareerKnight, the Rutgers job board site, and posted statistics on some of the internship offerings. In all, it’s been a fruitful experience that I decided to try to stick to after the completion of my studies.
Crime Map: First Iteration
As per the Cleary Act, the Rutgers Police Department (RUPD) releases crime statistics for the college and the surrounding area. They get thrown into a spreadsheet called a Daily Crime Log that you can copy and paste if you wish. There was an initial crime map created by Muckgers founders Chase and Shaodi based on this data that did not work as well as they had hoped. You would essentially upload an Excel document of one of the crime logs to a website and it would use the Google API to geolocate all of the points — it would then serve you back embed code. It was inconsistent, but it was the best that Chase and Shaodi could manage at the time. It was limited to desktop use, and was never really touched after one or two times. To make matters worse, it cost an arm and a leg to get anything useful out of it (yes, they offered a subscription to un-nerf it).
I immediately saw this as an opportunity to do something different.
Crime Map: Second Iteration
I was thinking about the best ways in which to make a new crime map work, when I was linked to other student crime maps by Chase. I wasn’t too impressed; for example, I saw one map that aggregated all of the incidents in a given area to make something like a “theft zone”, a cloud showing the severity of incidents, which I thought would be too abstract for our readers.
I believed it was important to be able to stand right near where a crime occurred, but I understood that too many data points could scare the reader or make them confused. My intention from the start was to put something together that was informative, but did not overwhelm.
Some of the examples in my head where a crime map of this type could be useful were:
- Parents asking their kids why there was possession of drugs in their dorms.
- A potential tenant to ask a home owner why there was a robbery there so recently.
- A commuter seeing that a given street was rife for car theft.
- Revealing that assaults happen in the evening in a given area.
I stumbled on a few blogs discussing the merits of a Google Fusion table. You can use it to do to a lot with data, and have the ability to denote a column to accept locational information. It lets you throw stuff onto a map and share it.
One you get your data into the table, it’s up to you to call for it in some Javascript to have it display on a web page, if you want to make it useful. There are plenty of examples out there to do this. You can make it as complicated as you want, with drop downs and buttons if you are experienced with JS. Admittedly, I am not yet, so this part was a huge hurdle for me. I really wanted to get something out fast.
Enter Mobile-Fusion-Tables: It’s a great solution made by Code For America’s San Francisco Brigade, where you simply enter your map information and some settings, and it will throw the data into an interactive web page.
Did I mention it was also mobile? Yea, they did an amazing job.
I wrote some custom Javascript that would only display incidents going back to the first of the previous month, instead of just subtracting 1 from the month (except January). I chose the first because of those pesky 28 days in February; if you went to a date like March 30th, it would most likely not query correctly — same with the 31st with some months.
An idea that I came up with was making sure that each version of the code would have a release like if it were a movie, The second iteration was called “Crime Map II: Crime Harder.” It was amusing to me, at least:
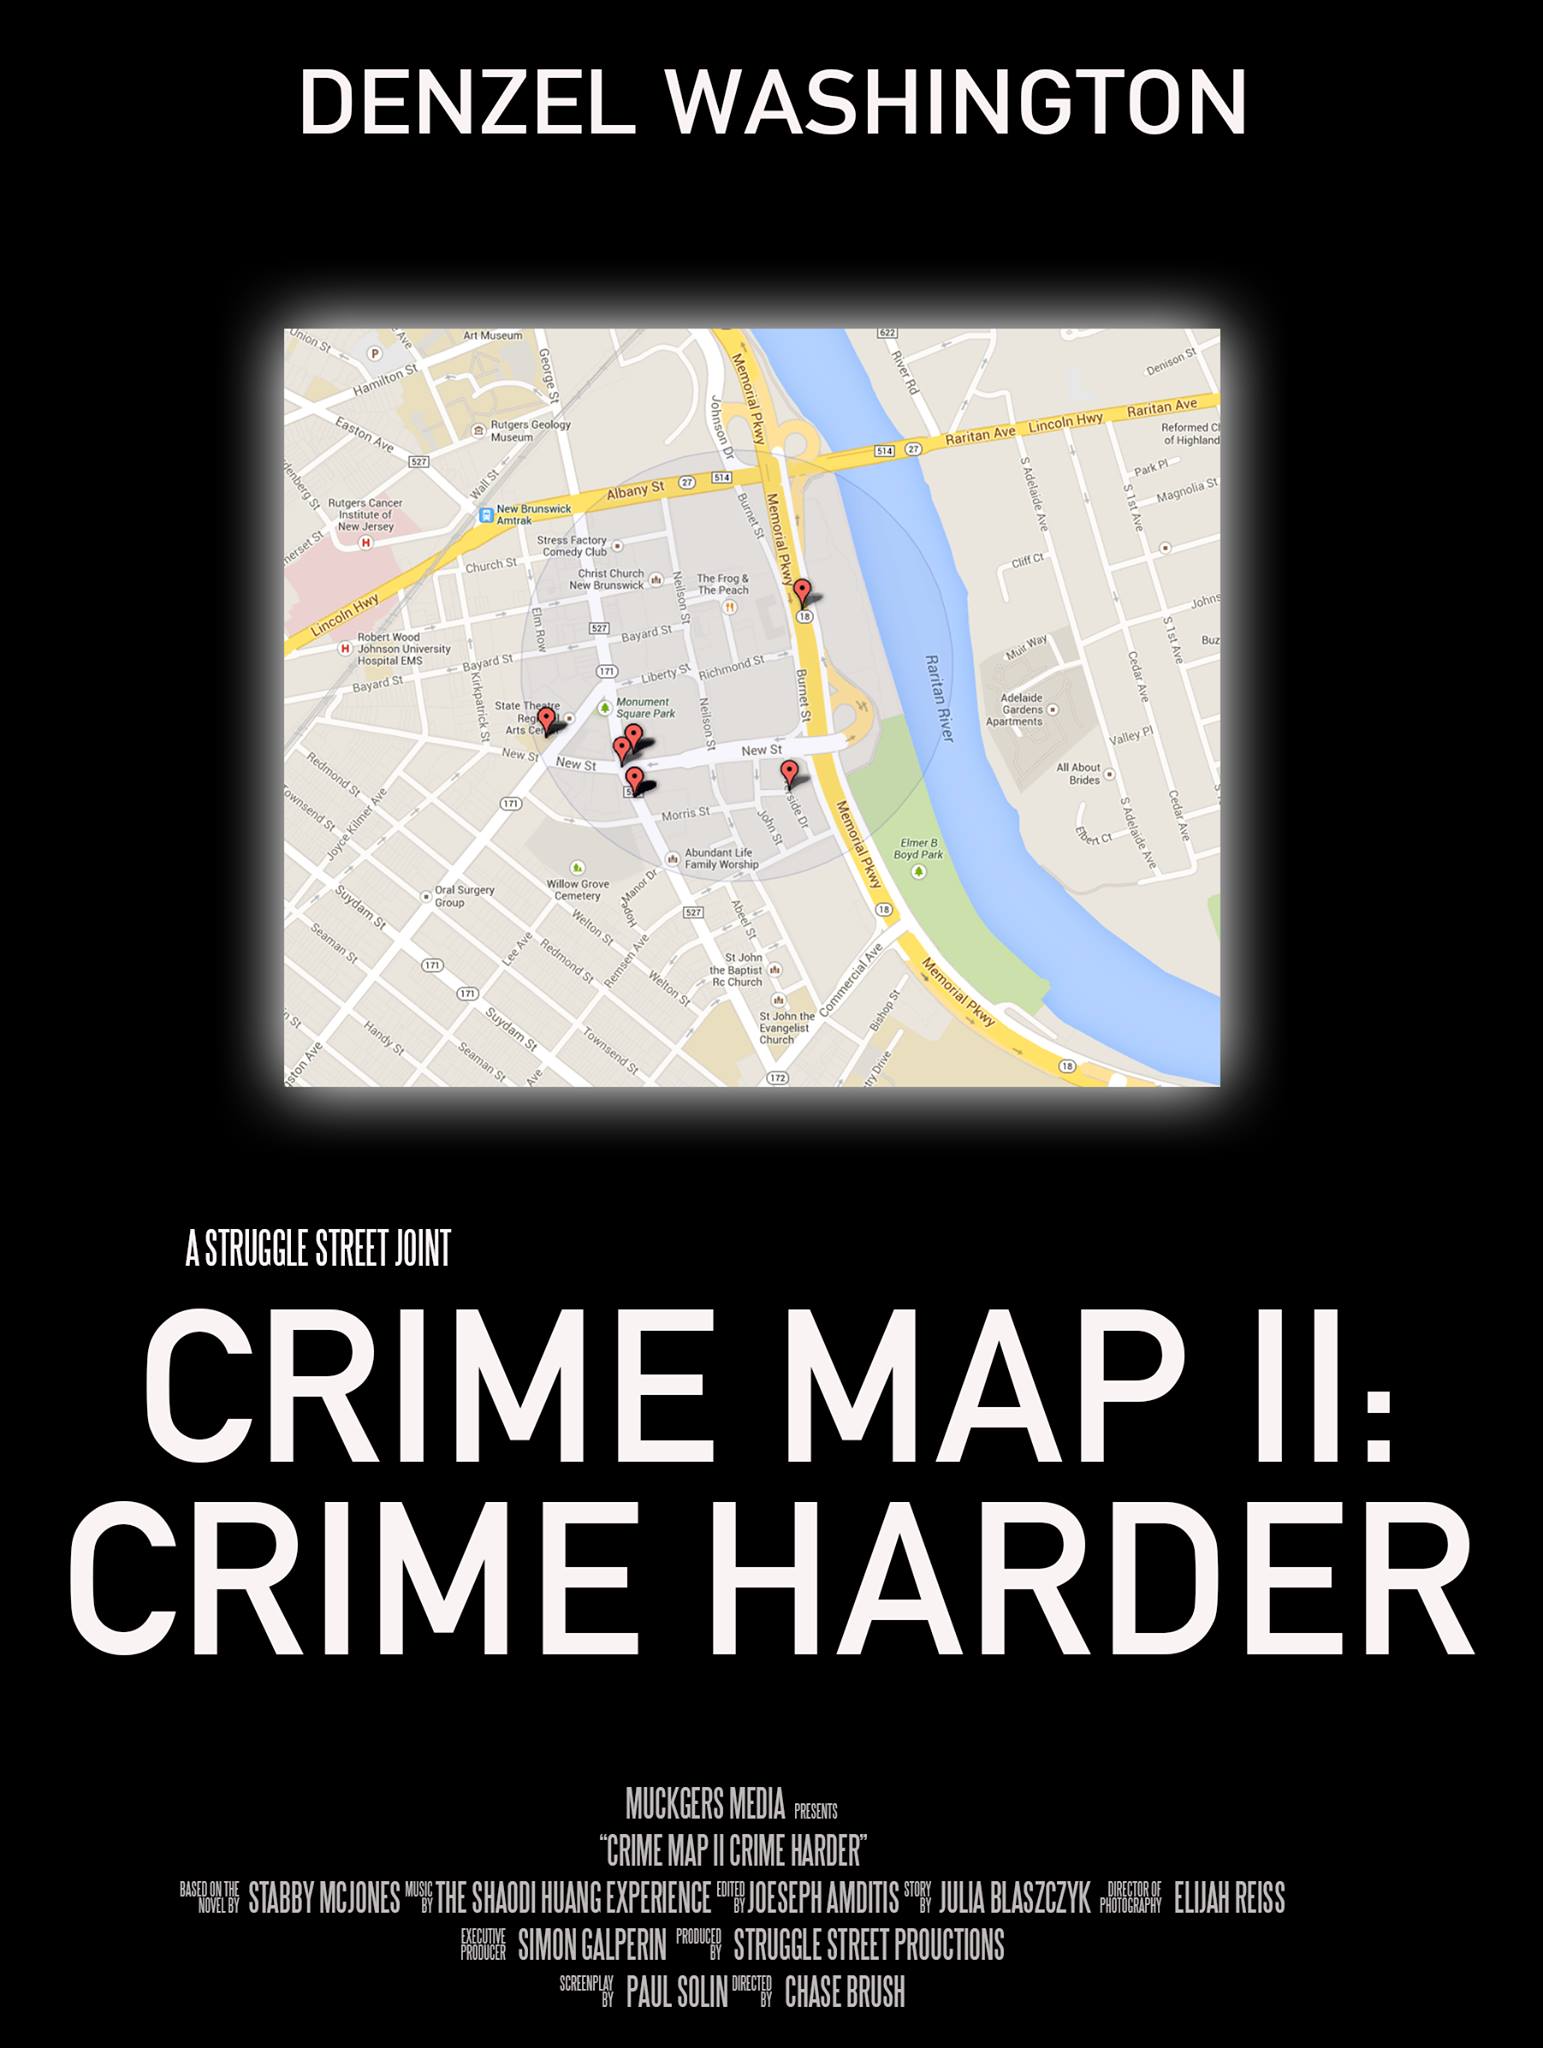
No, Denzel had nothing to do with this project.
The second iteration worked, but not as well as I had hoped for. There were some minor bugs and glitches. The data needed updating at least twice a month for it to be useful, but because the Rutgers Police put it in by hand, it was a hassle to split it all up. Which led me to…
Crime Map: Third Iteration
Scraping Code
I was experimenting with a Python-based scraper that would read the crime map data if it were linked to one of the spreadsheet-like websites containing all of the incidents. Way back in January or February, I coded something very basic that could pull the header row out of one of these documents and display it in code, but not much else. In early April, I returned to the code and was able to pull out, line-for-line, every single data point from one of these daily crime logs. It felt like a huge step in the right direction.
A new problem then arose: dates and times were merged together and not in the clean order that I wanted. For example, an incident date could be written like this:
0055 4/5/2014 - 0600 4/6/2014
I had to write a regular expression to pick out the four digits (\d\d\d\d) and denote that a piece of the string that looked like this was indeed a time value; I would have to insert a colon after the two digits so that if I threw it into a date/time column, it would show up correctly. I’d also have to replace the hyphen in the example above with a space, and say that any piece of the string with a slash in it was automatically considered to be a date.
Then, I had to write a huge conditional statement to determine how to order the pieces: date/date/time, time/time/date, etc. This ensured that they were getting fed into the correct columns: incident start date, incident end date, incident start time, incident end time.
I found that Google offered templates for coders using Python to allow them to tap right into their Fusion tables. This was a godsend; it only took a little while to get the code working correctly before I set something up that I would just have to call the code in Terminal and it would do its scraping.
Since the Fusion Table does not contain a primary key column, I treated the Case Number as if it were one. Every time the scraper found a case number, it would query the table to see if the entry already existed. If it did, it would ignore the entry and continue on with the code. This was important, because if I had to make a correction in a field, overwriting it would undo it. If a case number did not exist, it would create an INSERT query with the proper values and throw it into the table.
This is really only scratching the surface of the code I had to put together to properly parse the crime log date information. In all, I spent about a week on this part to make sure it was optimized.
When you want to create a Python package to post on Github or elsewhere, you’ll often include modules for other projects that the code is dependent upon. You end up creating a few folders in your project directory, and a file called setup.py that keeps track of everything. I found something called py2app that essentially takes your setup.py file, and instead of using it to install the code on another computer, it turns the project into a self-contained Mac OS X App. There’s no interface for it; in fact, all of the “print” lines appear in the Mac OS X Console. Since it was not a proper Cocoa app, I didn’t want to do much more than this with Python.
I ran across a program about a year ago called Lingon 3, that could take an app or a shell script and automate it to run hourly using OS X’s launchd feature. I kept it in the back of my mind for the time when I would need to use it. When I was finally finished with the scraper, I decided to buy it and tried to use it on the app. It didn’t work, so I wrote a shell script that only served to execute it, and scheduled that to run hourly:
open /Applications/Crime\ Scraper.app
It queued up alright, but I kept getting a weird error in Console, literally:
Job failed to exec(3) for weird reason
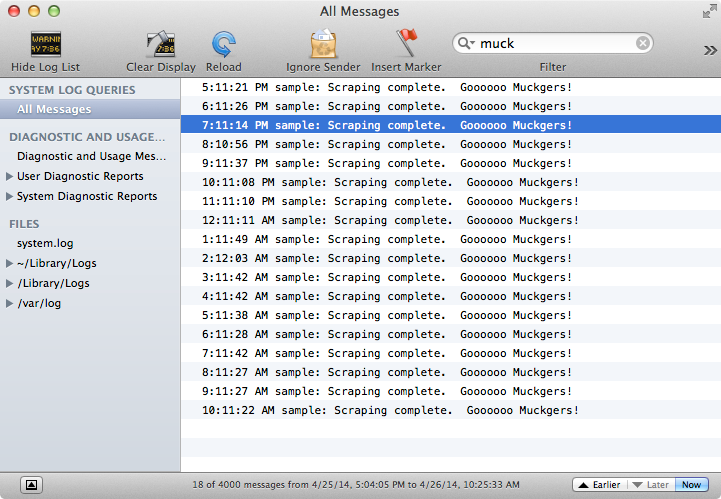
It turns out that the shell script did not have write permissions to do anything, so I had to go to the folder with the script and process it with the following command:
chmod +x the_script.sh
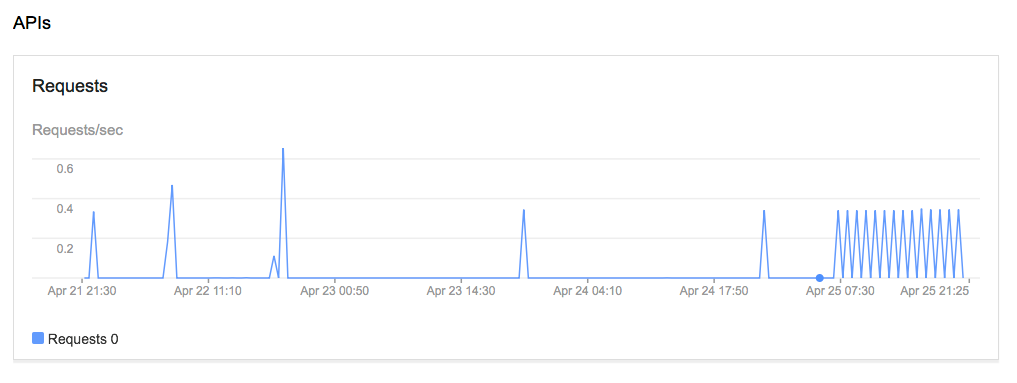
It then worked as it should, as you can see with a screenshot of my console and the API calls in my Fusion table project:
New Fusion Table
The scheme for the Fusion Table had also broke because Google decided to redo some stuff, so I re-downloaded the kit from sfbrigade, and re-coded the map and its features from scratch. I modified the “handlebars”, that is, the way that the data is called to be displayed on the website to ensure it looked a little slicker.
And of course, it was called a new movie, “Crime Map III: The Wrath of Crime.”
Conclusion
The number of things that I learned on this project have helped me think more about code, and connecting projects together for a wider audience. I’ve always been an avid programmer, but to be able to design something that could impact so many people gave me a pretty good feeling. And I still believe that there are no boundaries when it comes to coding — just what you don’t know yet.